Profile histogram in matplotlib
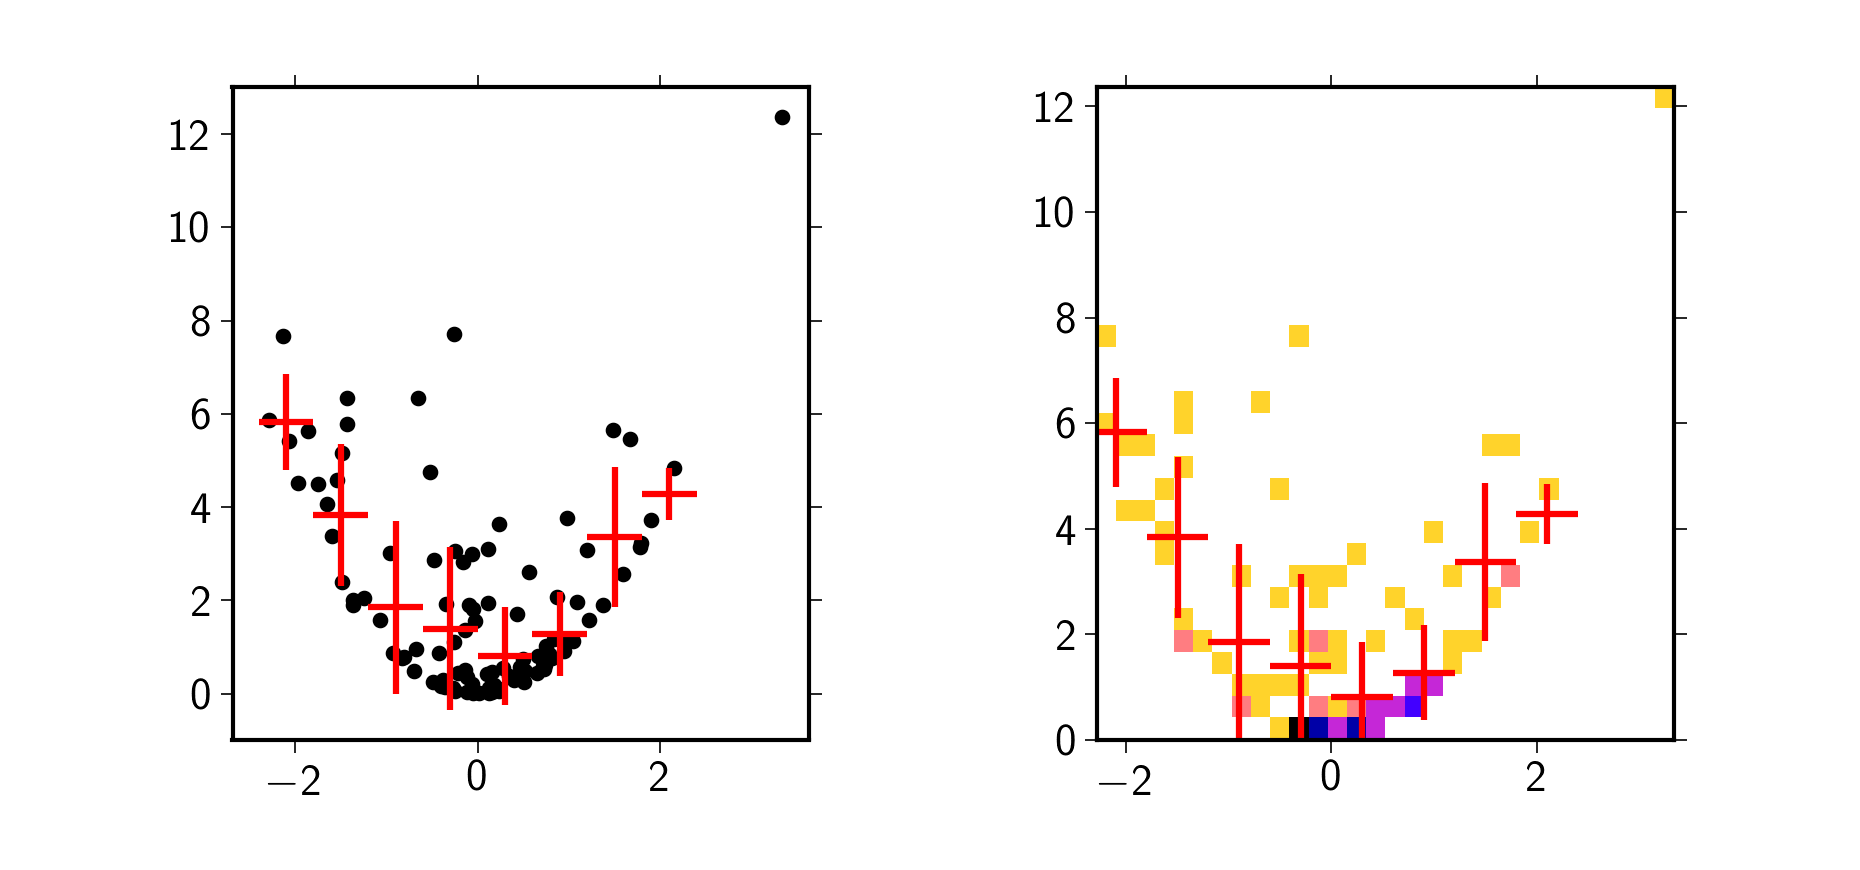
Profile histograms are an alternative visualization for 2D data where neither histograms nor scatter plots are satisfactory. Here the data is binned in one dimension and represented by the mean and spread in the other.
Scatterplot and Histogram of the same data with profile on top.
N = 100
X = random.normal(0,1,N)
Z = random.normal(0,1,N)
Y = (X**2 + Z**2)

binEdges = linspace(-3,3, 11)
data = asarray([X,Y]).T
x, dx, y, dy, N = Histograms.calcProfile(data, binEdges)

Figures.DoubleFigure()
subplot(121)
scatter(X, Y, marker='.', c='k')
errorbar(x,y, xerr=dx, yerr=dy, linestyle='None', c='r')

subplot(122)
hist2d(X, Y, cmap=cm.gnuplot2_r, bins=30)
errorbar(x,y, xerr=dx, yerr=dy, linestyle='None', c='r')
The function is part of the matplotlibtools.